Detailed analysis of Traffic Signal data

SCATS data are used by planners and modellers in different ways. Having at disposal several years of data allows for analysis on seasonality and traffic trends, while the granular details of the SCATS data allow for analysis on daily patterns, peak hours, busiest day and more.
Planners use the data to inform their decision on local interventions and modellers use SCATS to benchmark their model results.
As the raw data is provided in CSV files, WSP developed tools to easily extract the data for the required sites and dates, format the data to better suite digital data analysis, perform high level cleaning to remove days affected by faulty sensors, filter public holidays and school holidays.
WSP also developed a simple interface to facilitate the data extraction for internal users less familiar with software development. The app is designed to save time on data extraction and provide a user-friendly experience.
Datasets used:
- Traffic Signal Volume data
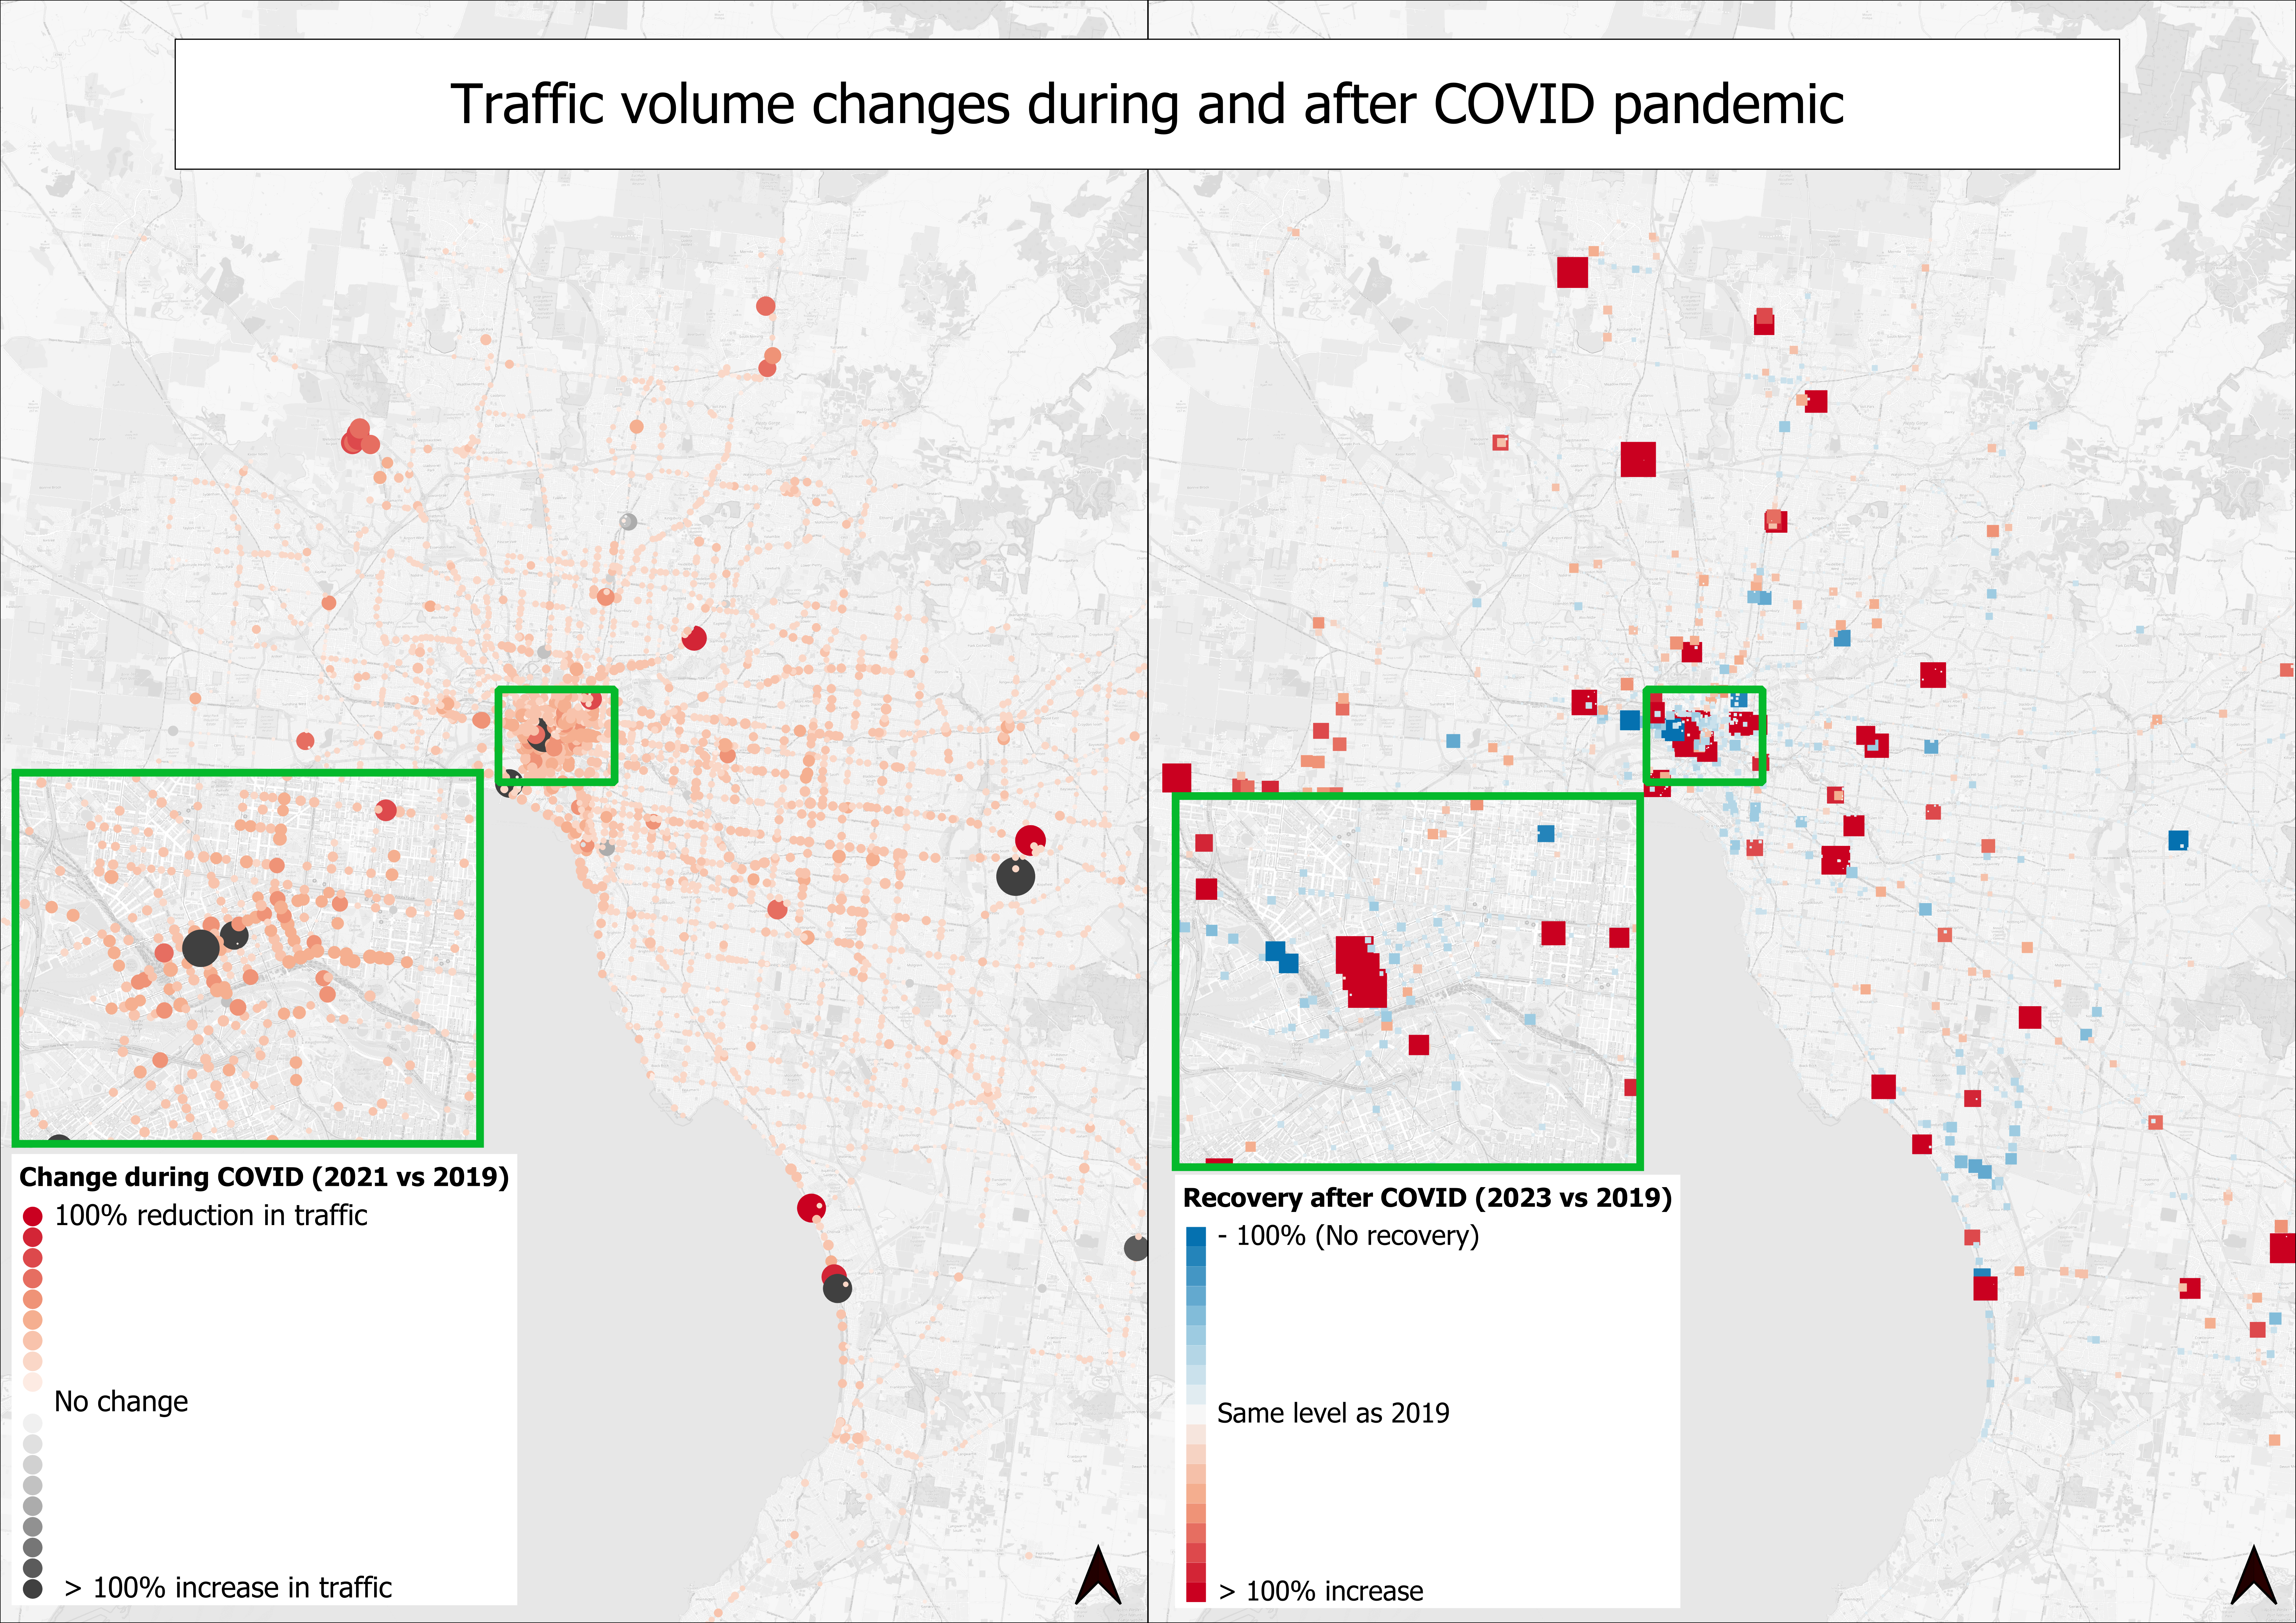
See the image below that highlights the Traffic Volume changes across Melbourne at signalised intersections before, during and after the COVID pandemic.
