Faster and consistent transport planning and traffic engineering analysis

Overview
Transport planners and traffic engineers rely heavily on SCATS and TIRTL (The Infra-Red Traffic Logger) data to inform decisions across the planning and design of our transport networks. However, working directly with large volumes of raw data can be time consuming, difficult to apply consistently, and challenging to scale across projects.
To support more efficient and consistent analysis, GHD identified an opportunity to better leverage the SCATS data provided by the Department of Transport and Planning (DTP) on its Open Data platform. By improving how this data is accessed and used, teams can develop a clearer understanding of network performance and support more informed planning outcomes, including the design of safer, more responsive streets.
Approach
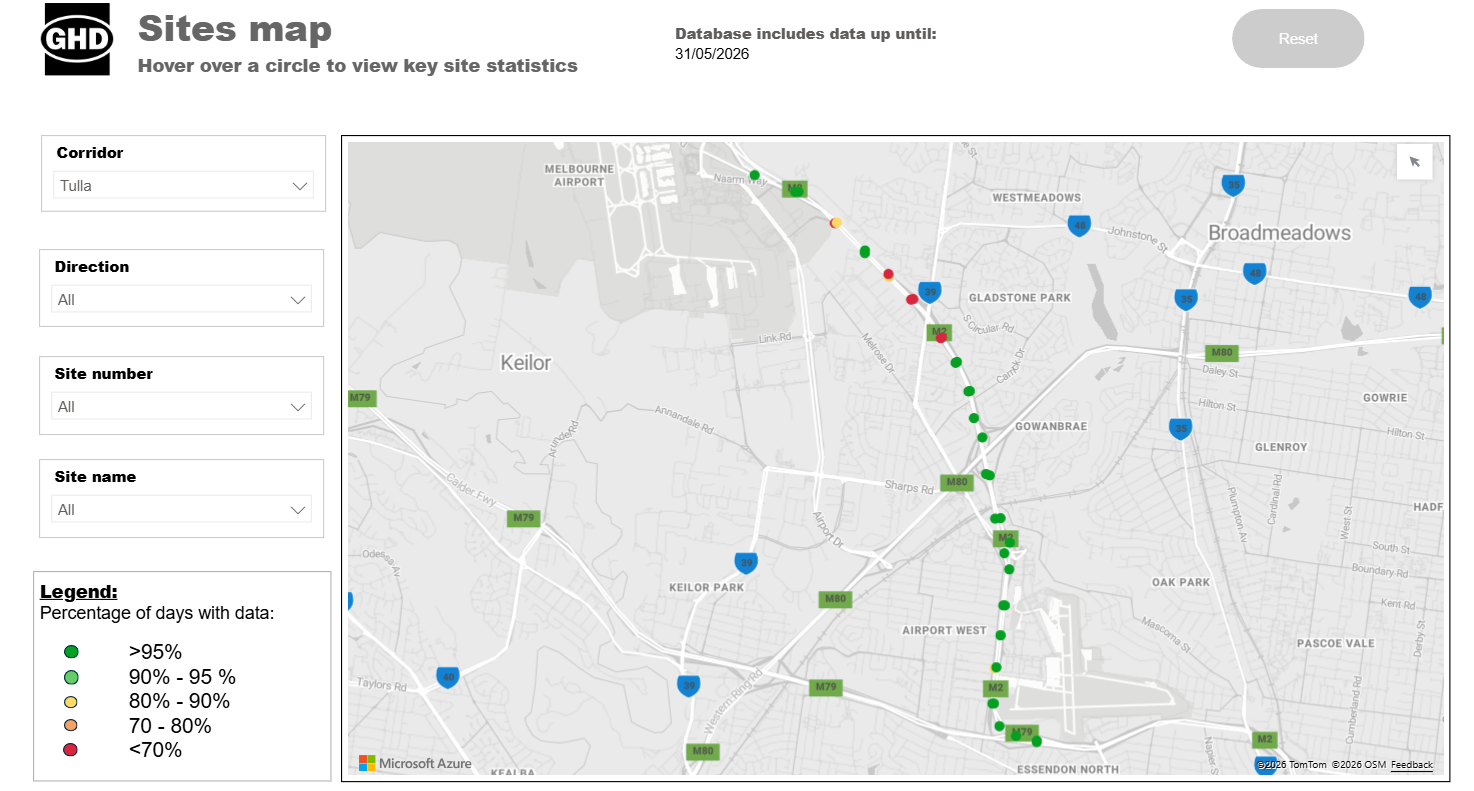
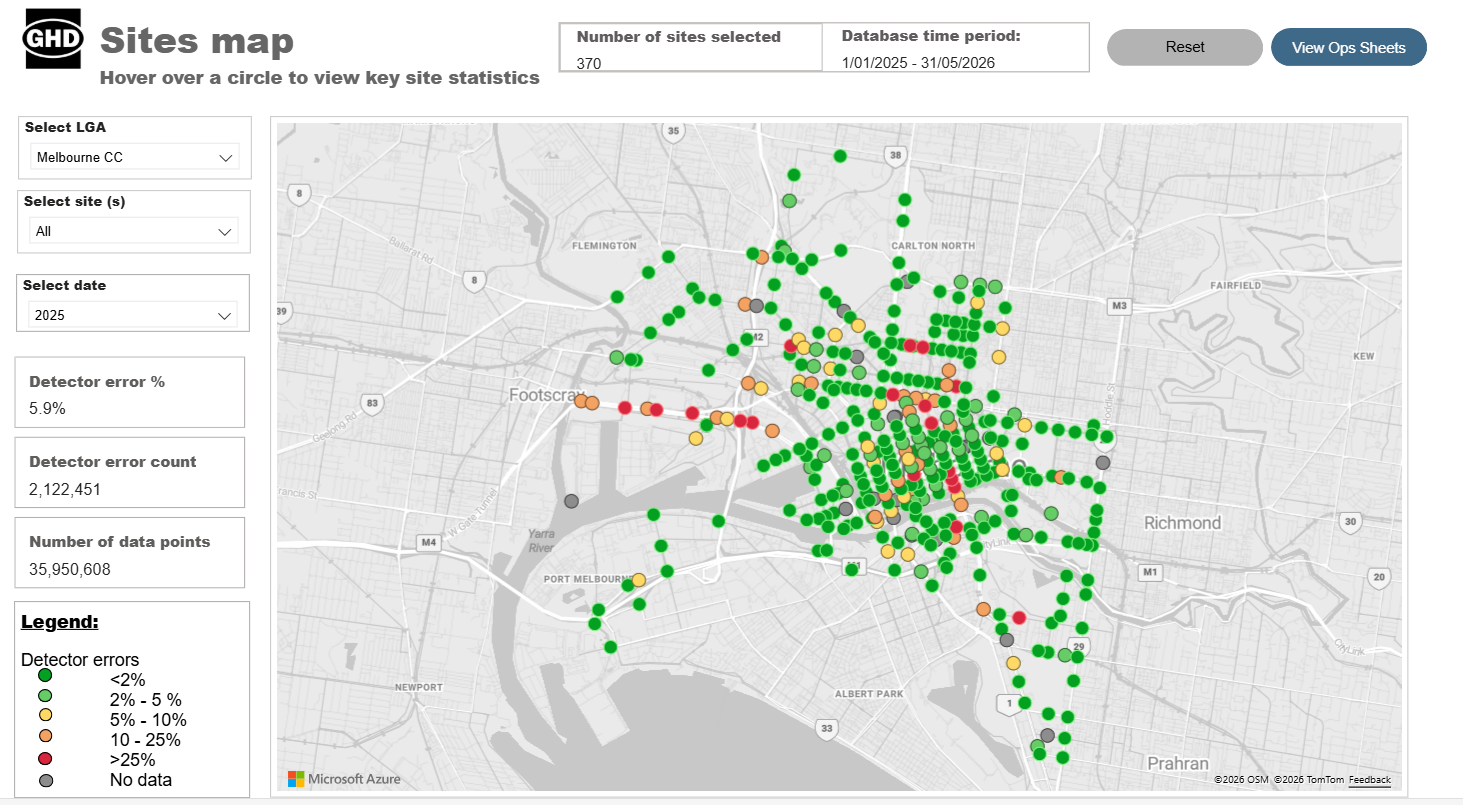
To enable more accessible and consistent use of SCATS and TIRTL data, GHD developed an interactive dashboard that transforms fragmented datasets into a single, structured and accessible source of truth.
The platform consolidates multiple years of data, removing the need for manual downloads and spreadsheet processing. Automated data preparation routines improve reliability by identifying and filtering out faulty data, public holidays and anomalous days, ensuring analysis is based on clean, consistent inputs.
Through the dashboard, project teams can quickly access and visualise:
- Peak periods and traffic patterns across networks
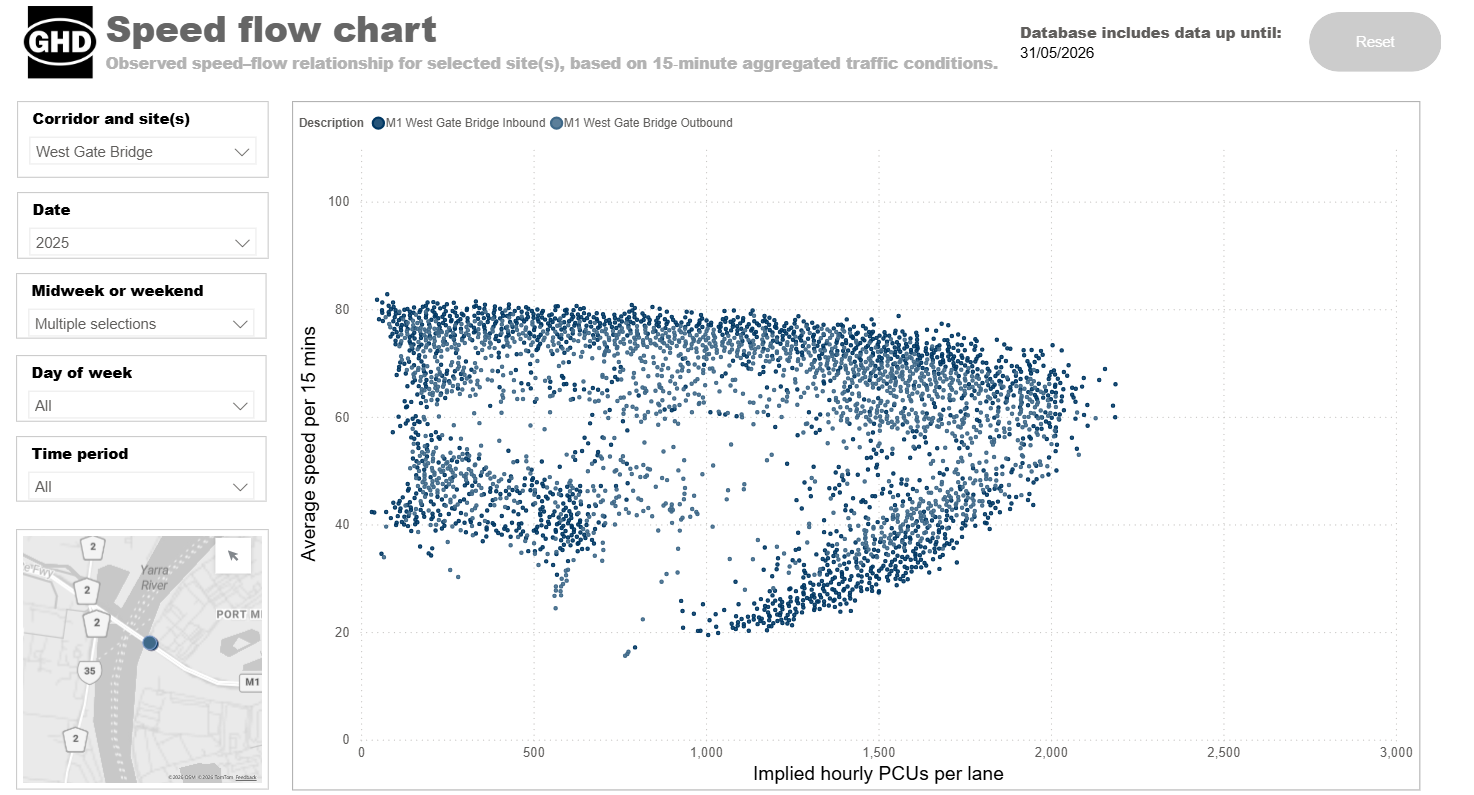
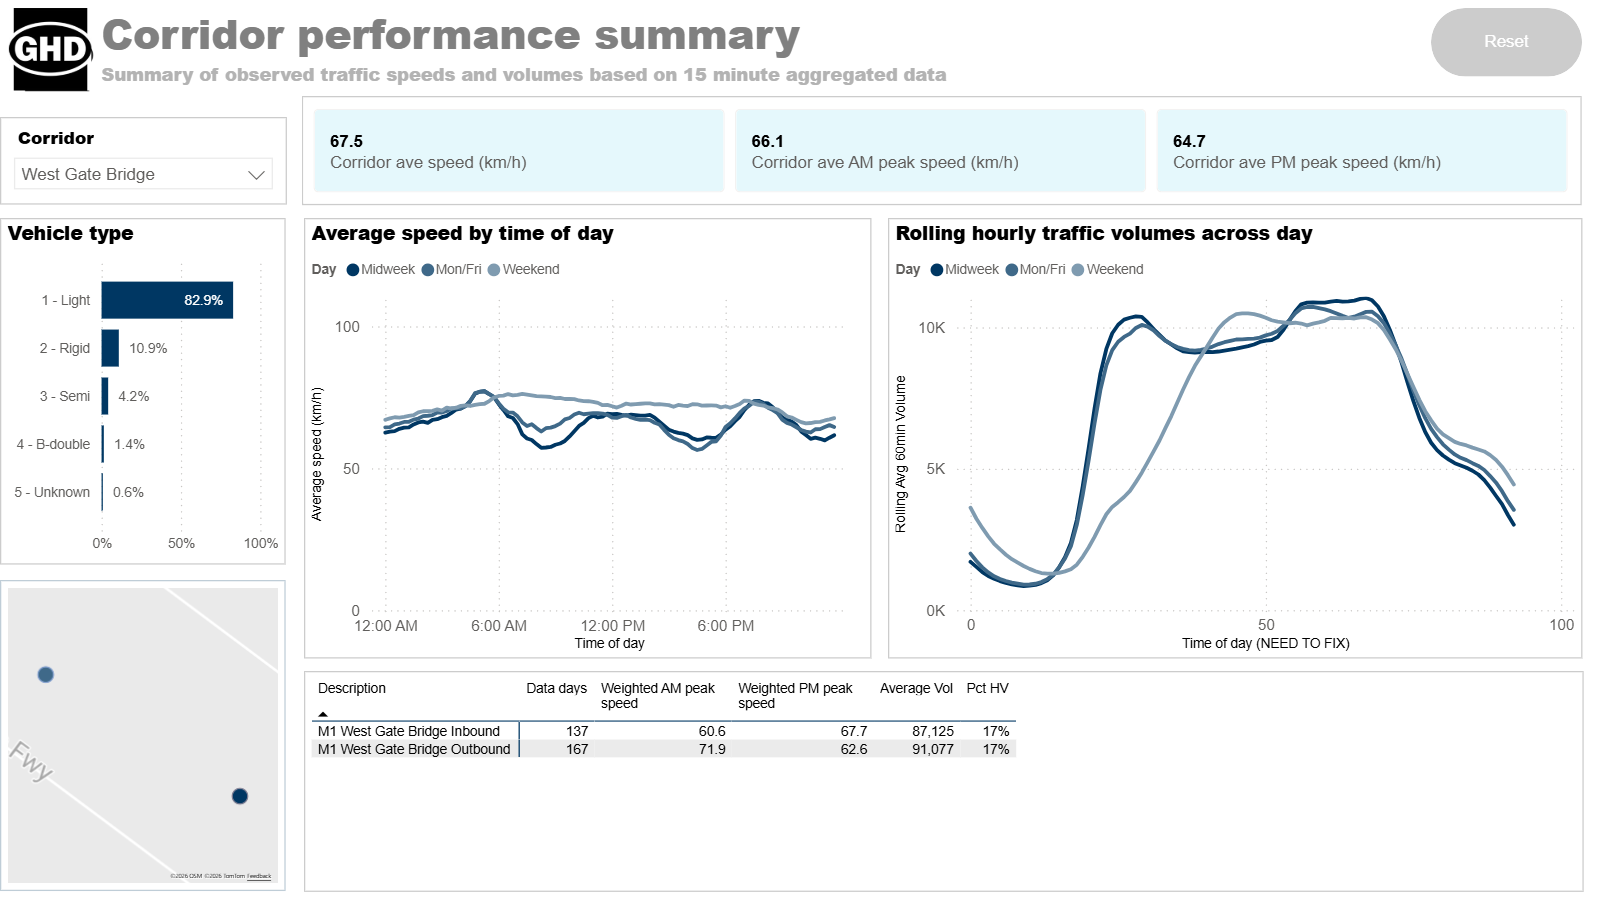
- Speed-flow analysis and vehicle type statistics on the freeway network
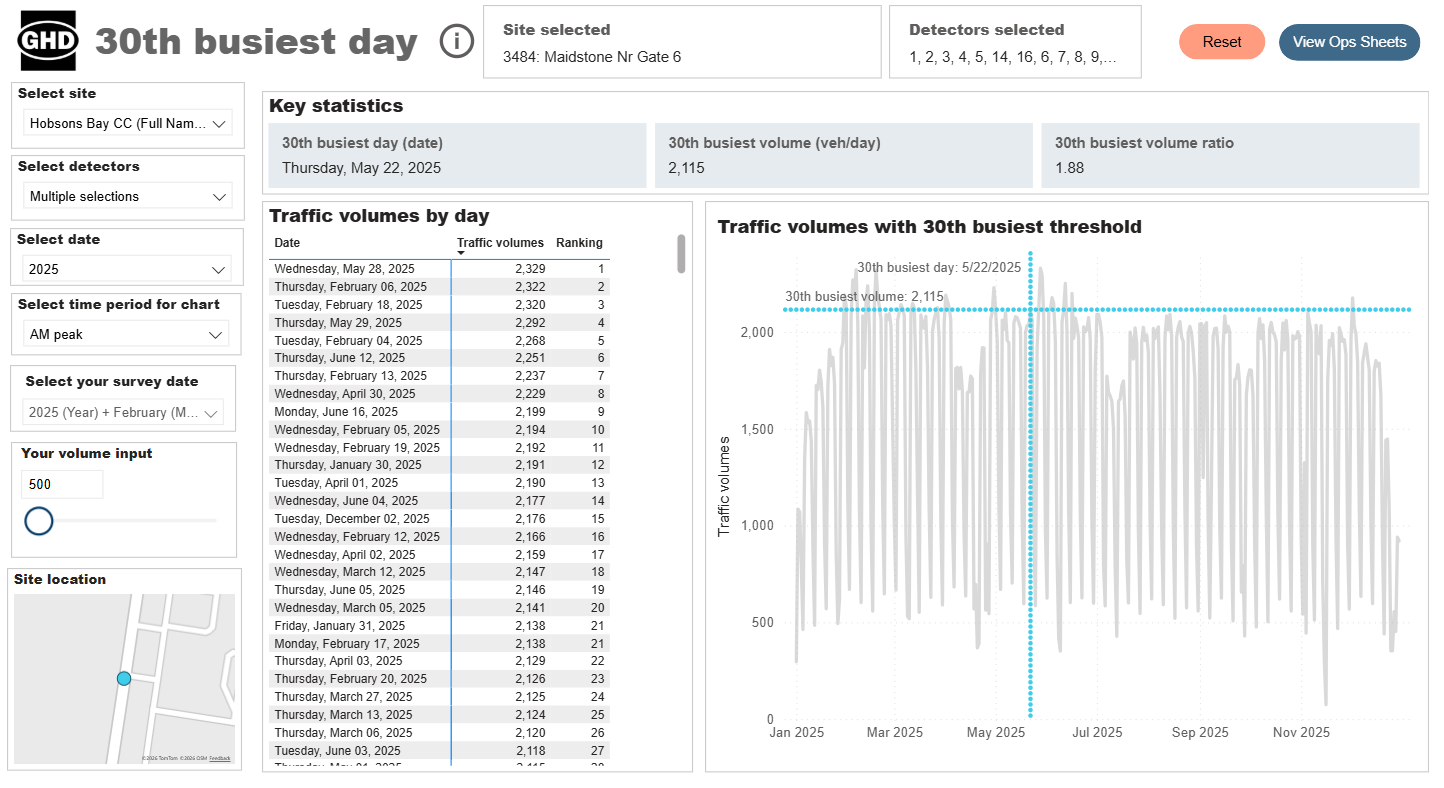
- The 30th busiest day and representative survey days for modelling
- Variations by time of day, weekday and weekend behaviour
- Changes in traffic conditions over time, the dashboard has data stored from 2014 onwards
- Intersection turning movements at signalised intersections
- Interactive visualisations allow users to explore traffic patterns across daily, weekly, monthly and seasonal timeframes, supporting both network-wide and site-specific analysis.
Datasets used
- SCATS data provided by the Department of Transport and Planning (Victoria)
- TIRTL data provided by the Department of Transport and Planning (Victoria)
Outcomes
The dashboard enables transport planners and engineers to analyse traffic data more efficiently and consistently, reducing the time spent preparing and validating datasets. With improved access to reliable, structured data, teams can more confidently interrogate network performance and identify trends.
Importantly, a clearer and more consistent understanding of traffic behaviour supports better planning and design decisions. By enabling earlier identification of patterns and potential risks, the tool contributes to the design of safer, more responsive streets and transport networks.
By bringing together open data and intuitive visualisation, the platform improves efficiency, consistency and confidence, helping project teams access defensible insights faster and apply a more consistent approach across projects.
SCATS DASHBOARD
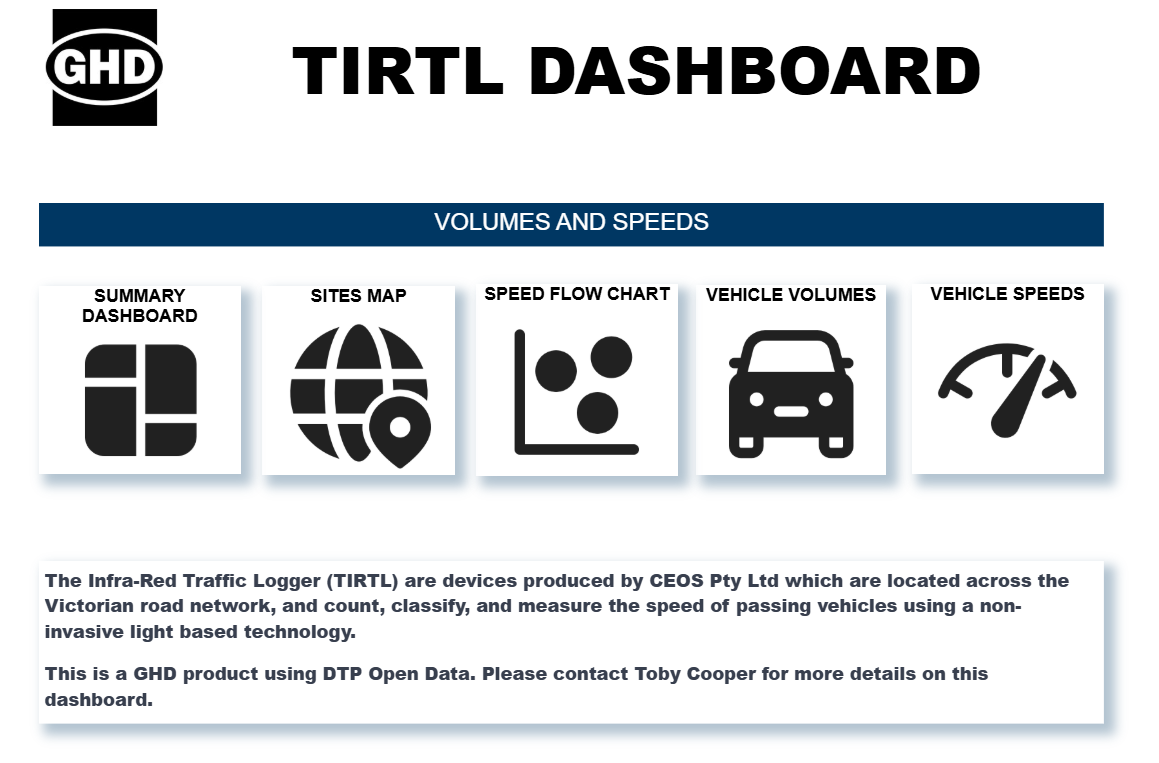
TIRTL DASHBOARD