Designing for safer streets

The transport and planning team at Arup are always working to design safe transport infrastructure. Analysing road crash statistics is required across the lifecycle of transport infrastructure projects and is a key part of planning, designing and delivering projects that are safe for all road users. To achieve this, they need access to timely and hyper-local data at their fingertips.
Approach
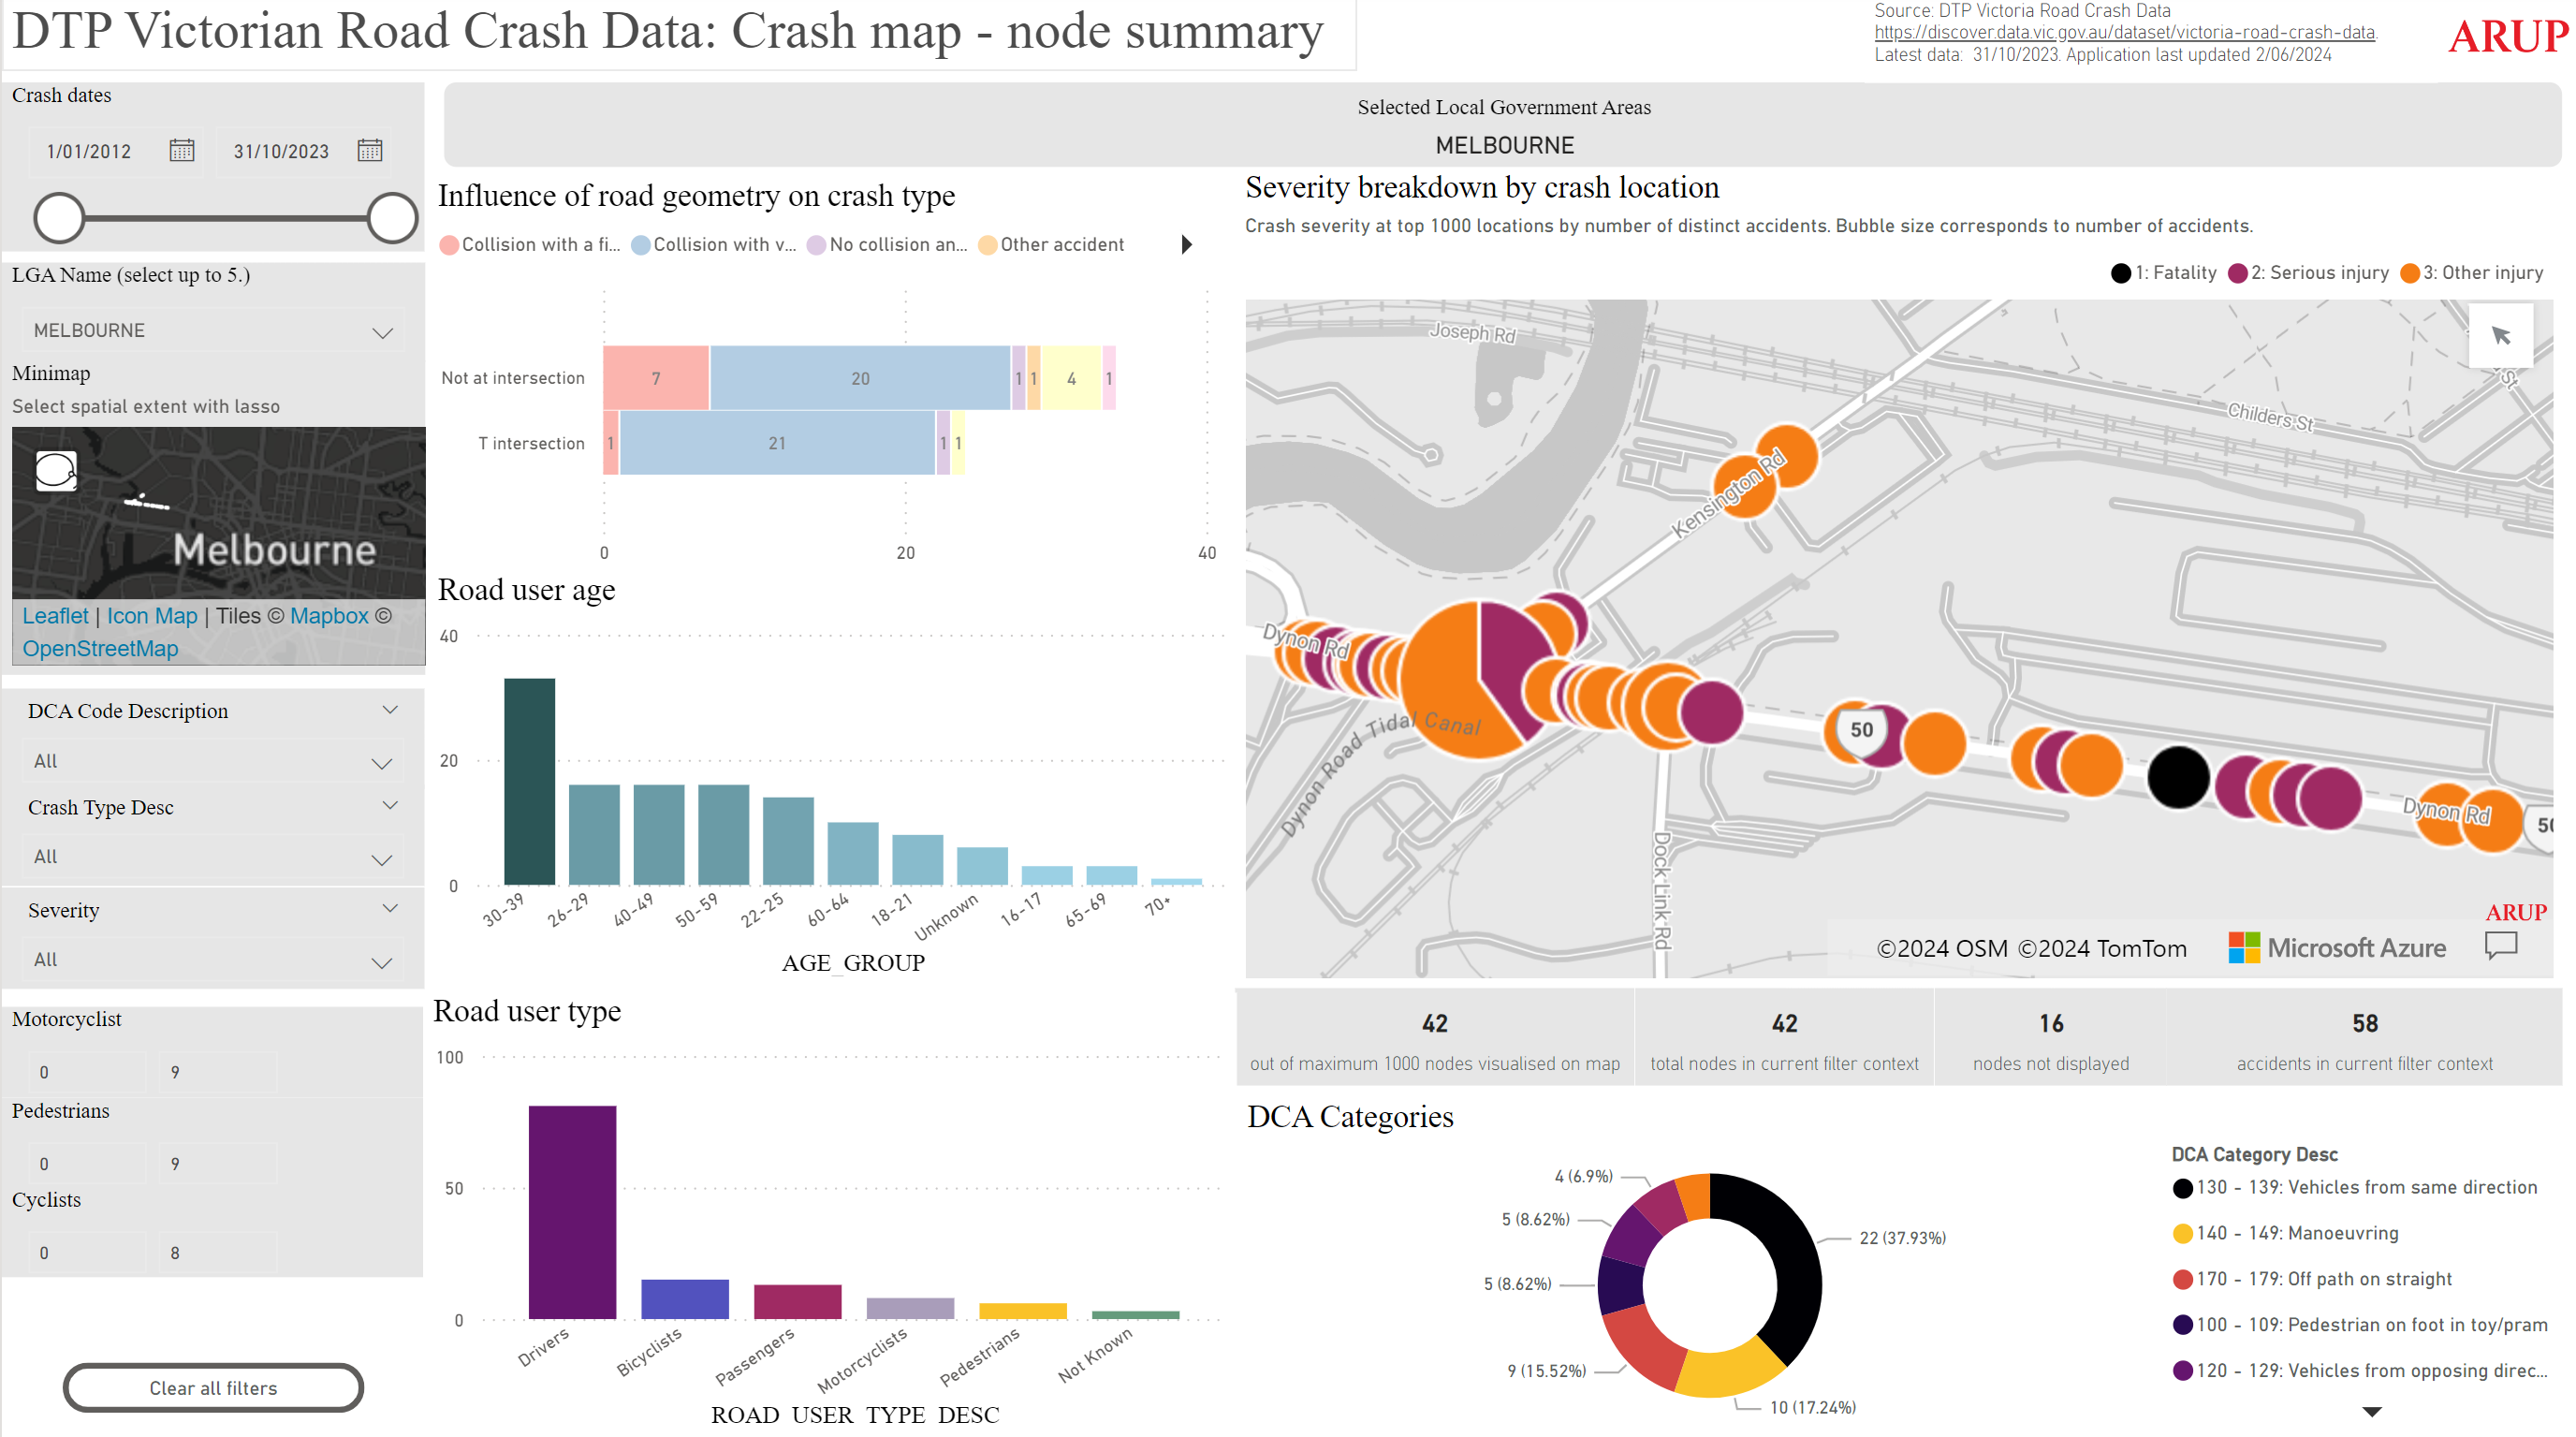
To ensure transport planners at Arup have the best available data, the Arup Digital Services and Transport Planning teams have developed a tool for readily accessing the DTP Crash Stats data, placing it on an interactive visual platform. Using the platform, Arup's engineers and planners can quickly and easily access and visualise information such as:
- Crash conditions such as time of day
- Weather conditions, driver profile, etc.
- Information on the location and existing road conditions.
Dataset used:
Victoria Road Crash Data
The visual data allows the team to identify and analyse road crash records, to better understand crash patterns including correlations between factors, to observe crash patterns before and after various interventions are implemented and ultimately to help inform project planning decisions.
Having access frequently updated data with detailed information on crash conditions, vehicle information and user details gives the Arup transport and planning team access the latest, relevant data and enables them to make informed decisions by understanding the full context of crashes that occur. This ready access to road crash data is having a significant impact on the design of our roads and intersections – helping deliver safer roads and streets across Victoria.